QUICK BRIEF
This brief describes the role of foreign-born people in the U.S. labor force, both historically and in the present day. The U.S. Bureau of Labor Statistics (BLS) defines a person to be “foreign-born” if they were not a U.S. citizen at the time of their birth.1 An equivalent way of saying this is that a foreign-born person is someone who was born outside of the U.S. (including its territories and outlying areas) to parents who were both not U.S. citizens. In this brief, we will describe the U.S. foreign-born population and labor force using data from the Current Population Survey (CPS) and American Community Survey (ACS). We will examine a number of metrics that describe labor force characteristics and/or the role of foreign-born people.
KEY FINDING NO. 1
The Foreign-Born Population Ages 16 and Older has Nearly Doubled in the 21st Century
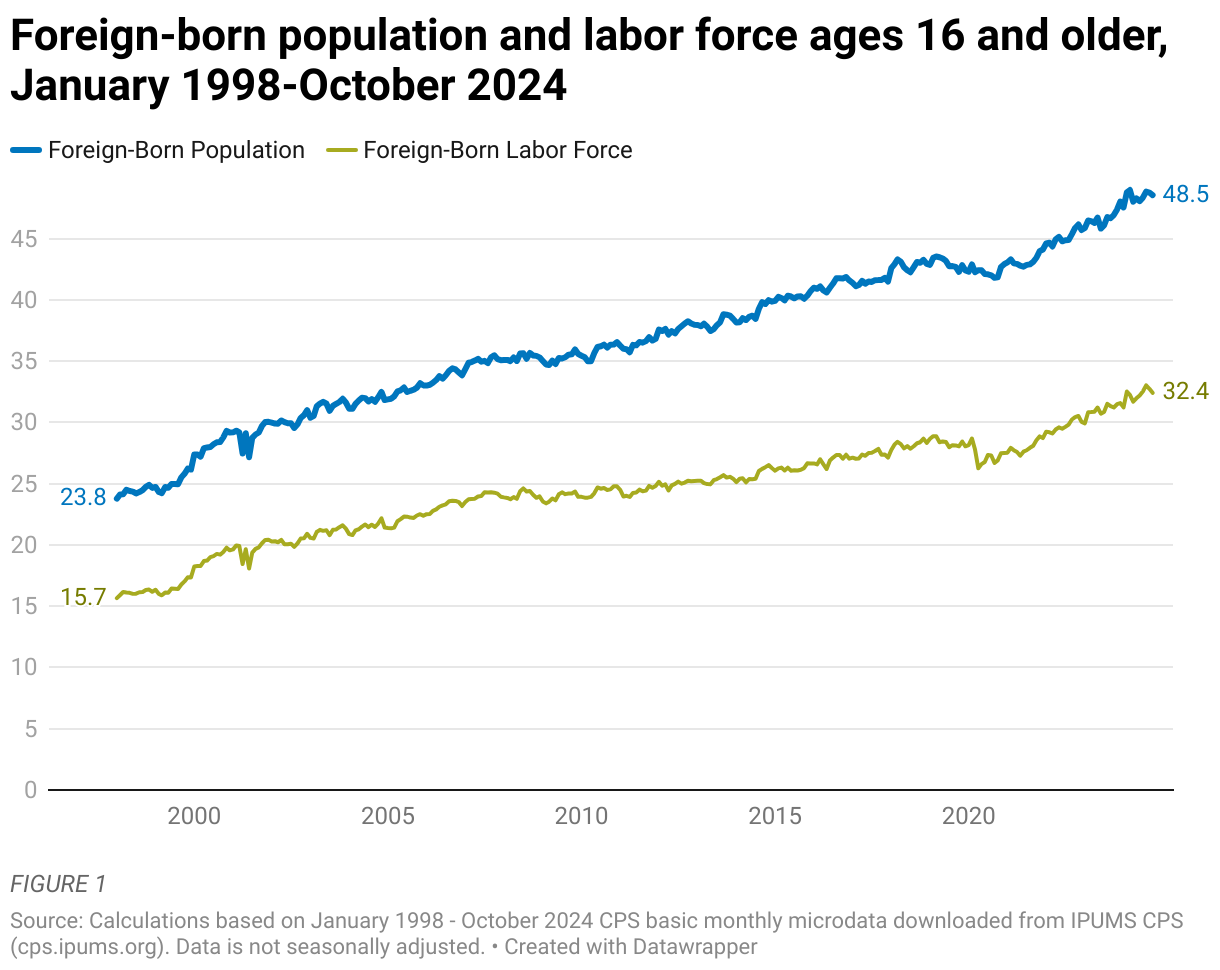
In January 1998, there were about 23.8 million foreign-born people ages 16 and older living in the U.S., including 15.7 million who were in the labor force. Both of these groups have roughly doubled in size since the start of the 21st century: As of October 2024, there were roughly 48.5 million foreign-born people ages 16 and older living in the U.S., including 32.4 million who are in the labor force.2
Although the main purpose of this figure is to demonstrate the long-run trend in foreign-born population and labor force size, close examination also reveals some notable short-run patterns. For example, growth in the foreign-born population and labor force appears to slow or stall during recessions, including a prolonged period of little to no growth during the Great Recession.3 This is an intuitive result, given that the labor market typically cools significantly during economic downturns and migration to the U.S. is dominated by people seeking gainful employment.
One other short-run trend of note is the substantial growth of the foreign-born population in recent years. Interestingly, this population had actually been declining slightly in the year leading up to the pandemic, and the initial wave in 2020 did decrease the foreign-born population further. However, by 2021, this decline had given way to an ongoing period of rapid growth. One critical consequence of this has been a surge in the foreign-born labor force, which grew by nearly 5 million people (17.7%) between January 2021 and October 2024.
Takeaways/Implications
48.5M
Foreign-born people ages 16 and older living in the U.S.
32.4M
Foreign-born people ages 16 and older participating in the U.S. labor force.
17.7%
Increase in the foreign-born labor force between Jan 2021 and Oct 2024.
KEY FINDING NO. 2
Foreign-born People Ages 16 and Older Are Much More Likely to Be of Prime Working Age
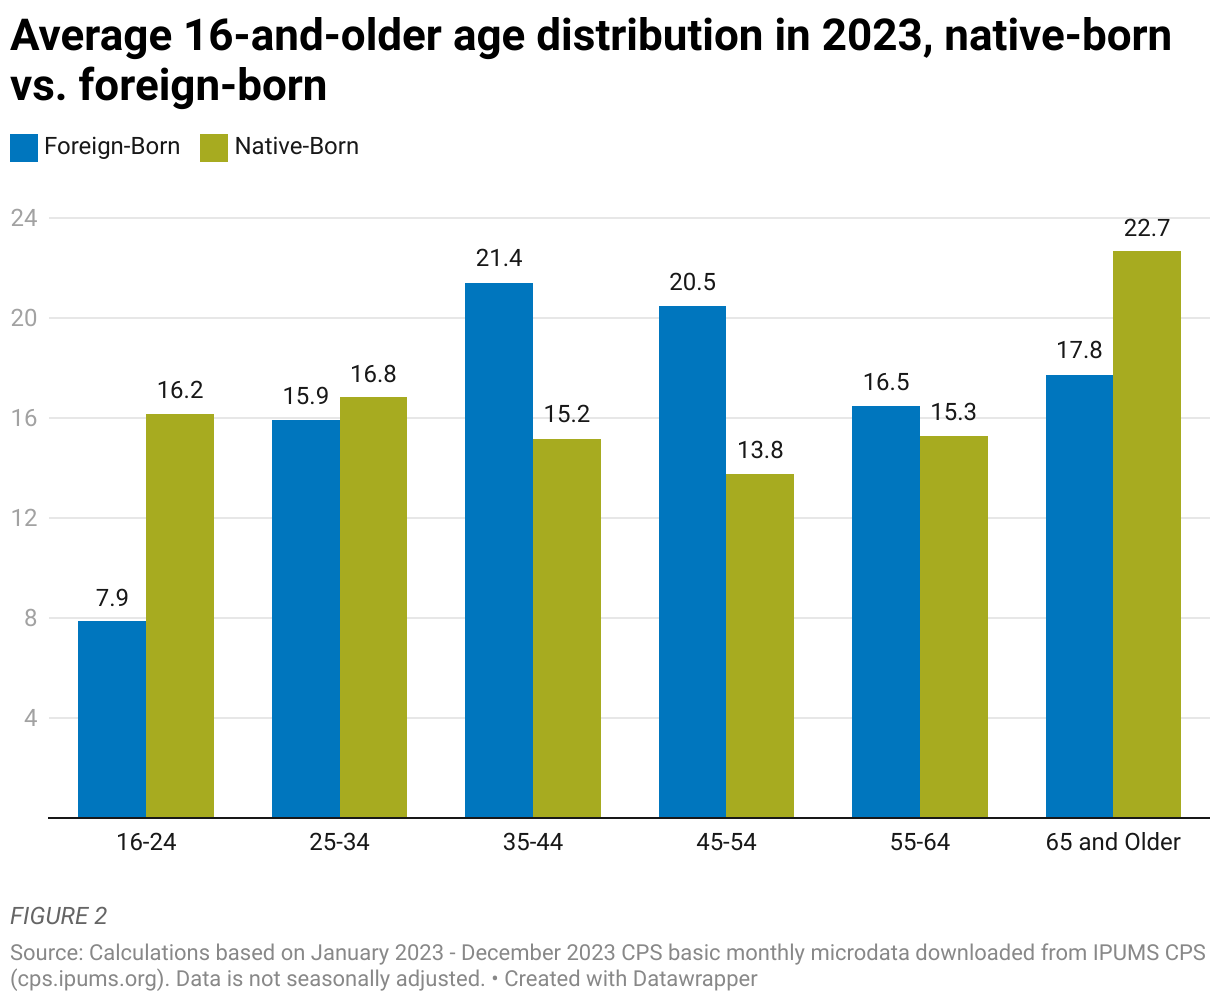
The figure below compares the average age distributions of native-born and foreign-born U.S. residents ages 16 and older in 2023. The most notable difference between these two groups is that foreign-born U.S. residents are far more concentrated in the 35-54 age range and far less concentrated in the oldest and youngest age groups. As a result, nearly three-fifths (57.9%) of the foreign-born population are ages 25-54 (i.e., prime working age), compared to just 45.8% of the native-born population. Because people in this age range tend to exhibit significantly higher labor force participation, one would expect foreign-born residents to have an outsized impact on the labor force.
Takeaways/Implications
57.9%
Foreign-born population ages 25-54 (prime working age).
45.8%
Native-born population ages 25-54 (prime working age).

KEY FINDING NO. 3
Foreign-born People Ages 16 and Older Are Significantly More Likely to Be in the Labor Force
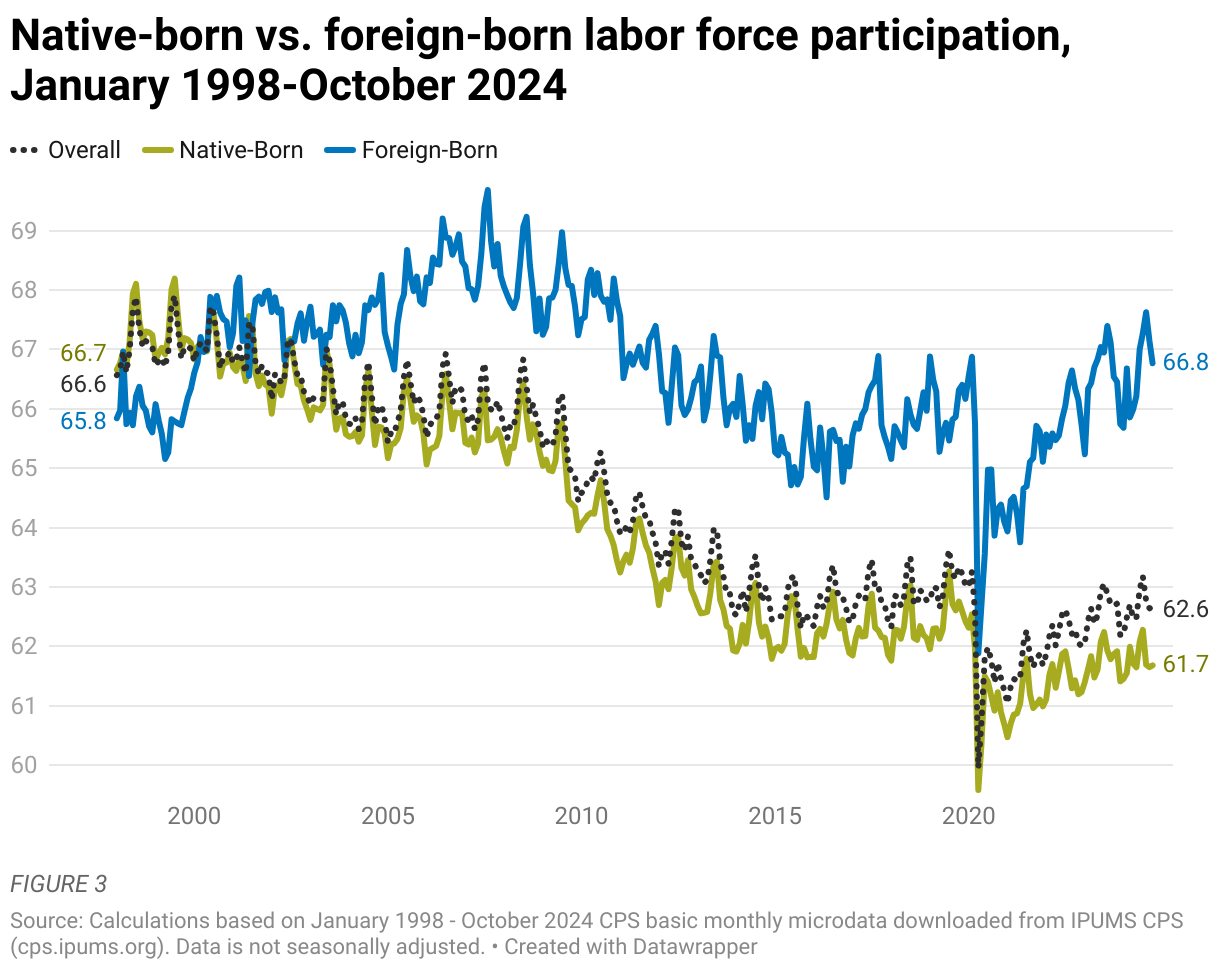
At the turn of the century, the labor force participation rates of native-born and foreign-born people ages 16 and older were roughly comparable; however, in the 21st century, the native-born participation rate has fallen steadily, while the foreign-born rate has increased slightly. Consequently, the foreign-born labor force participation rate as of October 2024 (66.8%) was over 5 percentage points higher than the native-born rate (61.7%).
Although several factors likely play a role in these divergent rates, one key issue is that the native-born population has aged steadily in the 21st century, which has put downward pressure on labor force participation in this population. In contrast, aging among foreign-born residents has been dampened by a constant influx of comparatively young migrants. For this reason, immigration is often discussed as a critical tool for meeting labor demand as the U.S. population continues to age.
Takeaways/Implications
66.8%
Labor force participation rate among foreign-born individuals (Oct 2024).
61.7%
Labor force participation rate among native-born individuals.
KEY FINDING NO. 4
Nearly 20% of the U.S. Labor Force Is Foreign-born
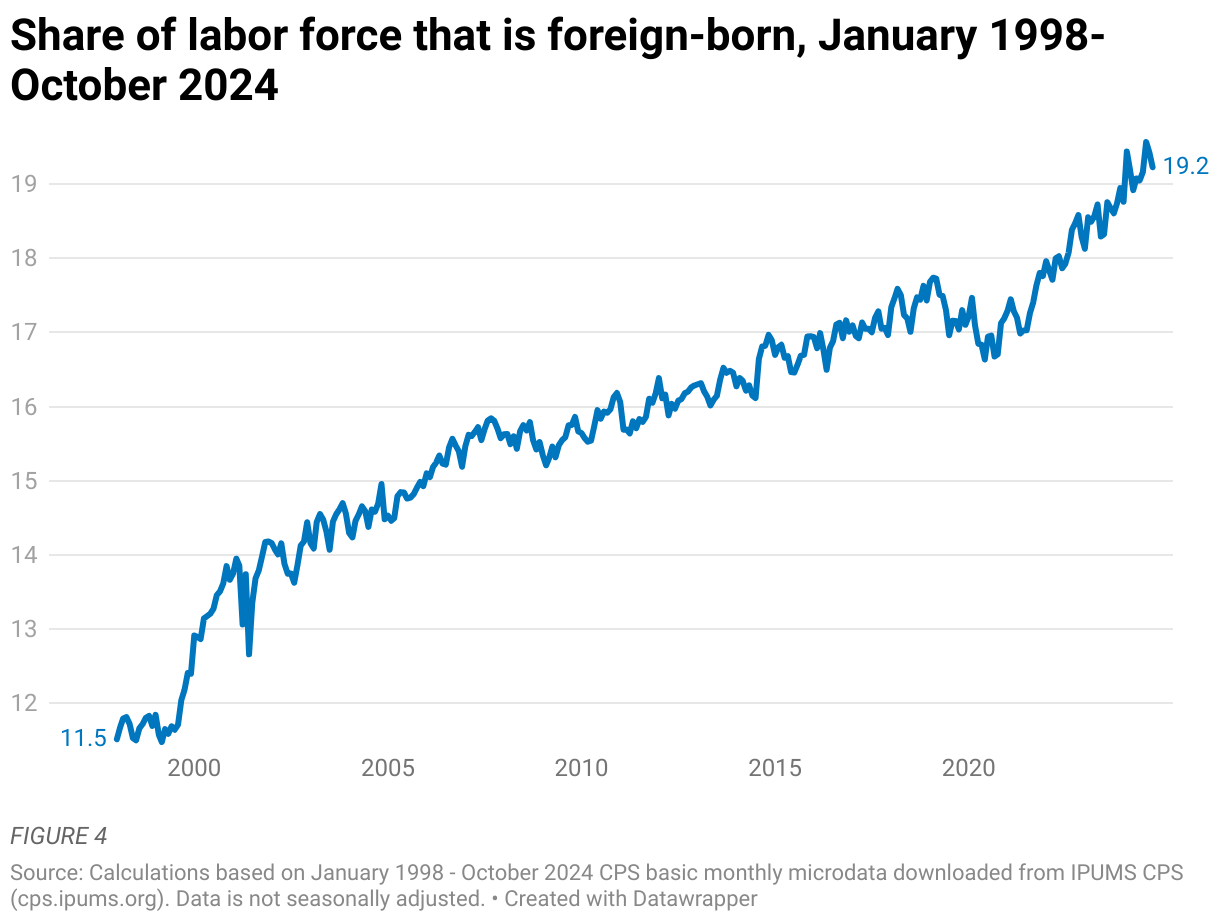
Due to strong growth in the foreign-born population ages 16 and older and the comparatively high labor force participation rate of this population, foreign-born people now account for nearly 1 in 5 members of the U.S. labor force. This fraction is up from roughly 1 in 8 around the turn of the 21st century, though its growth has not always been consistent. For example, the foreign-born share of the labor force grew rapidly for a short period in 1999-2000, stagnated during the Great Recession, and fell somewhat between early 2019 and late 2020. After falling to 16.6% in June 2020, the foreign-born share of the labor force rose rapidly and stood at 19.2% in October 2024.
Takeaways/Implications
19.2%
U.S. labor force composed of foreign-born participants (Oct 2024).
1 in 5
members of the U.S. labor force are foreign-born.
KEY FINDING NO. 5
Representation of Foreign-born People in the Labor Force Varies Significantly by State
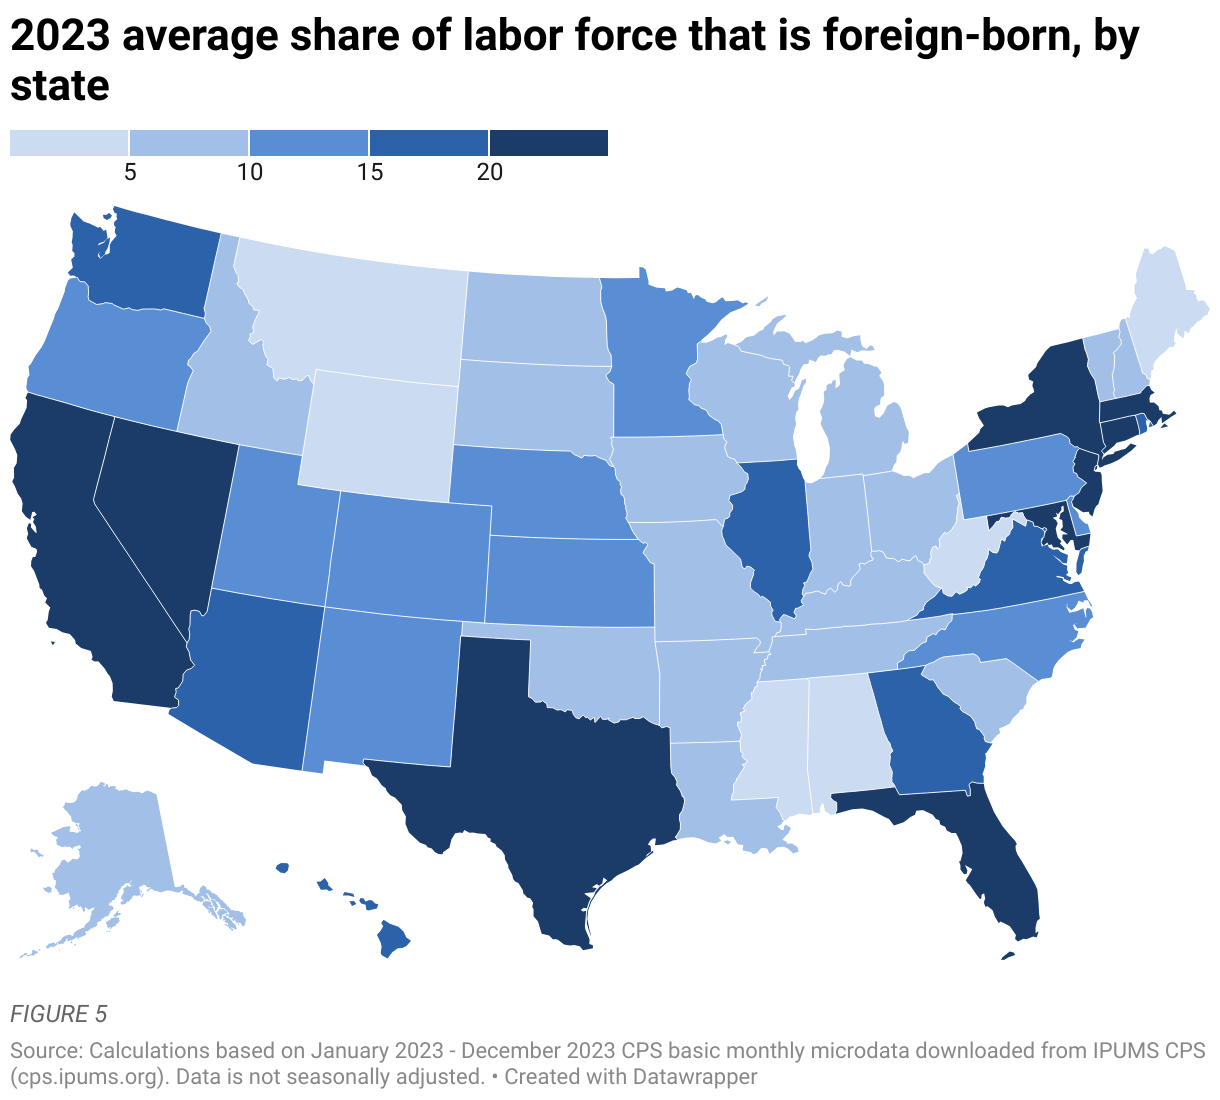
Although about one-fifth of the overall U.S. labor force was foreign-born as of October 2024, this varies considerably by geographic location. Figure 5 demonstrates this fact by plotting the average foreign-born labor force share for each state in 2023. Unsurprisingly, states that have a strong historical association with immigration (e.g., California, New York, New Jersey, Texas, and Florida) tend to have very high foreign-born labor force shares; in fact, about one-third of all labor force participants in California and New Jersey were foreign-born in 2023. On the opposite end of the spectrum, there are six states in which the average foreign-born labor force share was less than 5% in 2023, including West Virginia, which had the lowest rate at 1.97%.
Takeaways/Implications
33.4%
Foreign-born labor force share in New Jersey and California (2023).
1.97%
West Virginia had the lowest rate of foreign-born labor force in 2023.
KEY FINDING NO. 6
Native-born and Foreign-born Average Unemployment Rates Tend to Be Similar
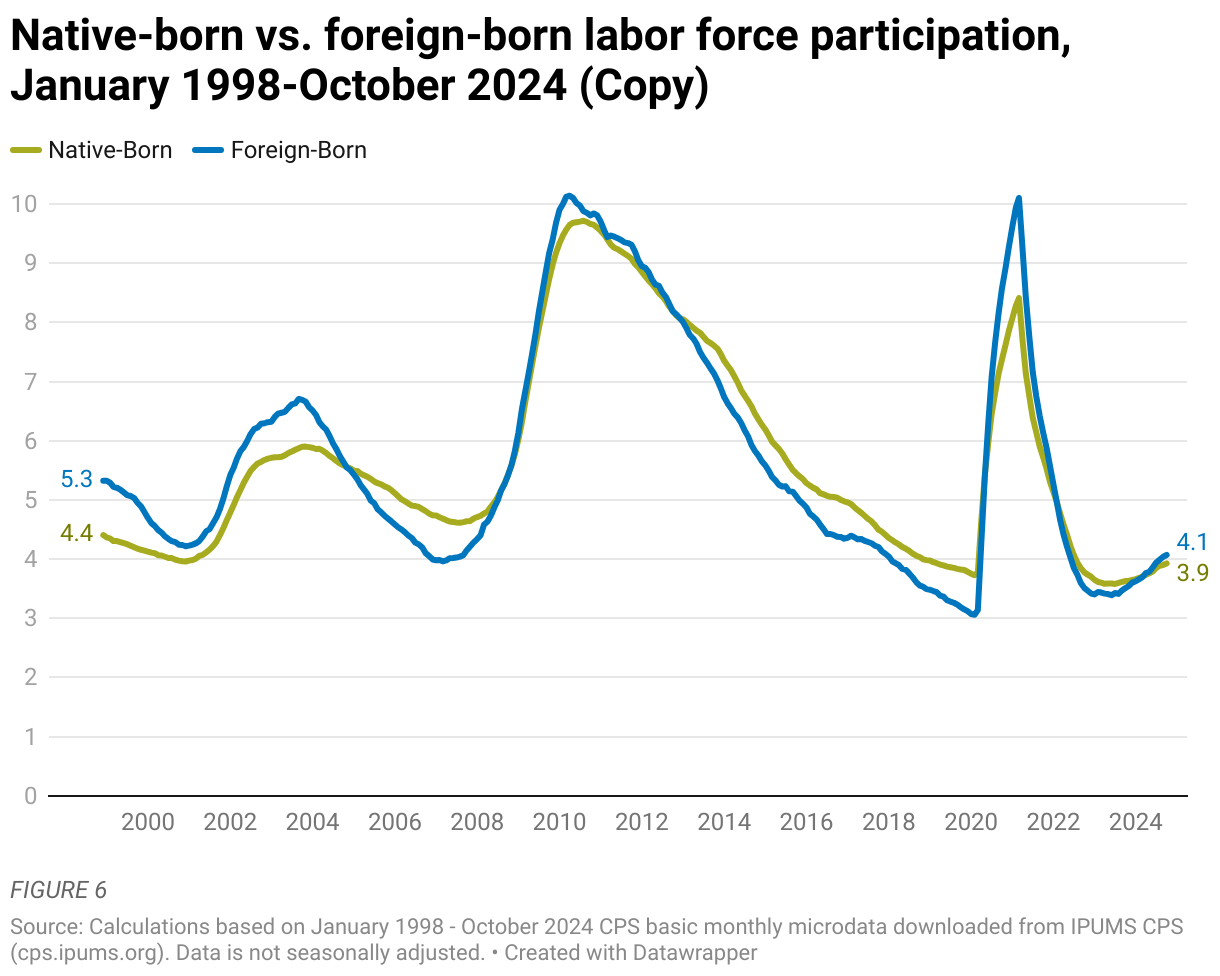
Figure 6 compares trends in native-born and foreign-born unemployment rates across time. To eliminate noisy month-to-month variation in unemployment rates, we examine the 12-month average unemployment rate for each group. In any given month, this rate is calculated as the average unemployment rate for the group in question during the most recent 12-month period.
The trends in Figure 6 demonstrate that native- born and foreign-born average unemployment rates are highly correlated. However, there are some interesting differences that stand out across time. Most notably, we find evidence that the average unemployment rate of foreign-born labor force participants slightly exceeds that of their native-born counterparts (at least briefly) during severe economic downturns (e.g., the Great Recession and the pandemic lockdown period). Conversely, the average foreign-born unemployment rate tends to fall below that of native-born labor force participants during periods of economic recovery/growth, including most of the 2010s. As of October 2024, the 12-month average unemployment rates for these groups are roughly equal.
Takeaways/Implications
4.1%
Average unemployment rate for foreign-born workers (Oct 2024).
3.9%
Average unemployment rate for native-born workers.
KEY FINDING NO. 7
Foreign-born Workers Account for at Least 25% of Employment in 4 Major Occupational Groups
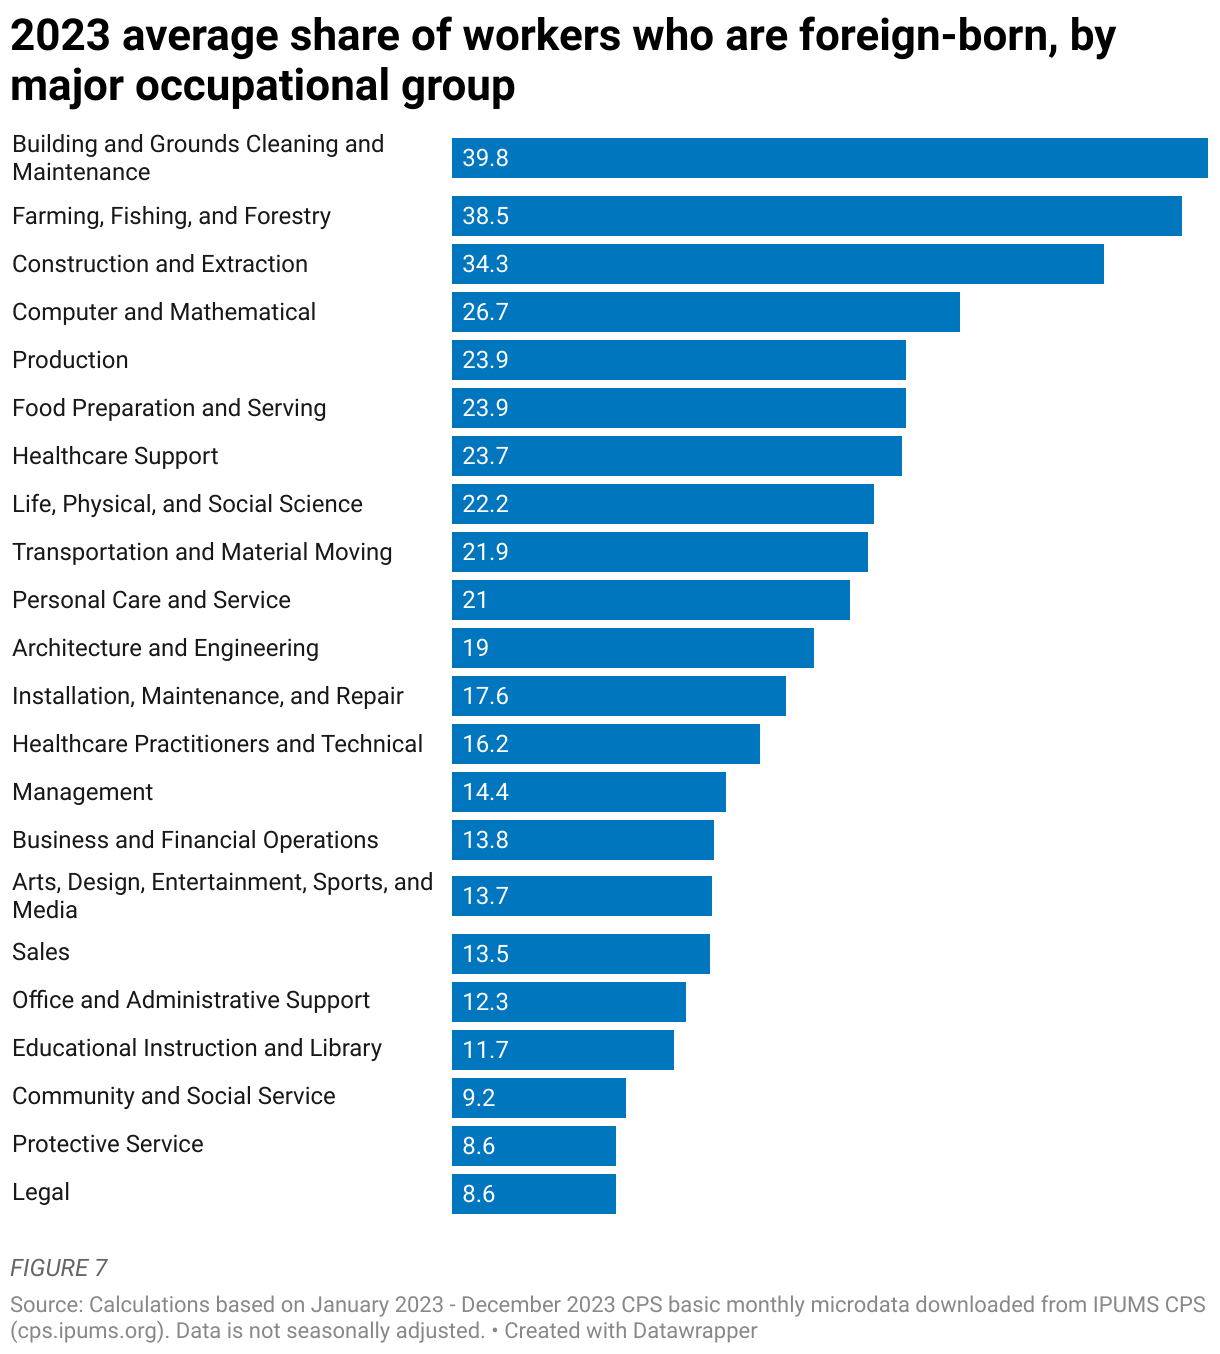
Figure 7 examines the average representation of foreign-born workers across major occupational groups in 2023. On average, foreign-born people accounted for 18.6% of all workers in this year; however, representation varied significantly across occupational groups. On the high end, foreign-born people accounted for over one-quarter of employment in four major occupational groups (building/grounds cleaning/maintenance, farming/fishing/ forestry, construction/extraction, and computer/ mathematical). Conversely, less than 10% of workers were foreign-born in the legal, protective service, and community/social service groups.
In reviewing these findings, we see several relationships between occupational characteristics and foreign-born representation. Perhaps most notably, foreign-born workers appear to be especially common in occupational groups characterized by manual labor. However, it is also critical to emphasize that foreign-born representation is high in occupational groups that emphasize highly disparate skills. For example, the representation of foreign-born workers is just under 24% in production, food preparation/serving, and health care support, despite the fact that these groups differ markedly from 10 one another in a wide variety of ways. Finally, even at their lowest level of representation, foreign-born workers still account for over one-twelfth of all workers; as such, there is no occupational group in which foreign-born people account for a negligible fraction of labor.
Takeaways/Implications
39.8%
Foreign-born workers among building, grounds and cleaning roles.
34.3%
Foreign-born representation in construction jobs.

KEY FINDING NO. 8
Foreign-born Workers Account for at Least 20% of Employment in 7 Industries
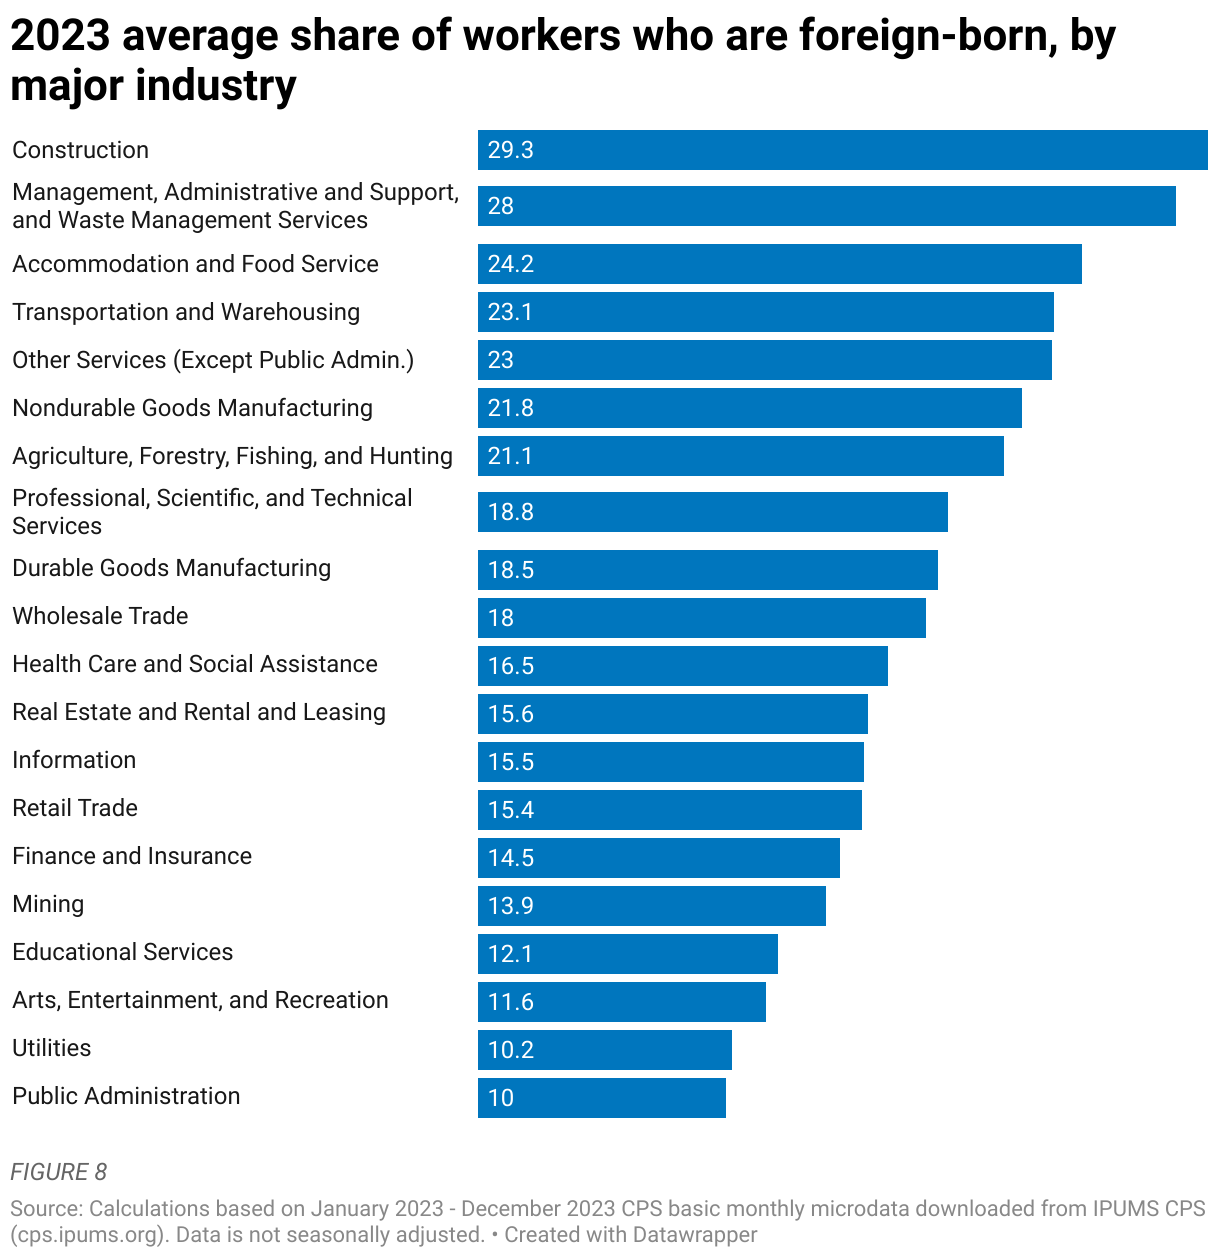
Figure 8 reports the average representation of foreign-born workers across major industries in 2023. As mentioned above in our discussion of foreign-born representation across occupational groups, foreign-born individuals accounted for about 18.6% of all employed people in 2023, on average; however, this varied significantly by major industry, from a low of 10% (public administration) to a high of 29.3% (construction).
As was the case in our examination of representation across occupational groups, we find evidence that major industries requiring highly manual and/or routinized labor tend to have high foreign-born representation; however, it is also true that foreign-born workers are well-represented in industries demanding very different skill sets. In fact, in 2023, there was no industry in which foreign-born workers accounted for less than one-tenth of all workers, on average.
Takeaways/Implications
29.3%
Foreign-born workforce in construction (2023).
10%
Foreign-born workers contribute across all major U.S. industries.
KEY FINDING NO. 9
Nearly 75% of Foreign-born Labor Force Participants Come from Just 20 Countries
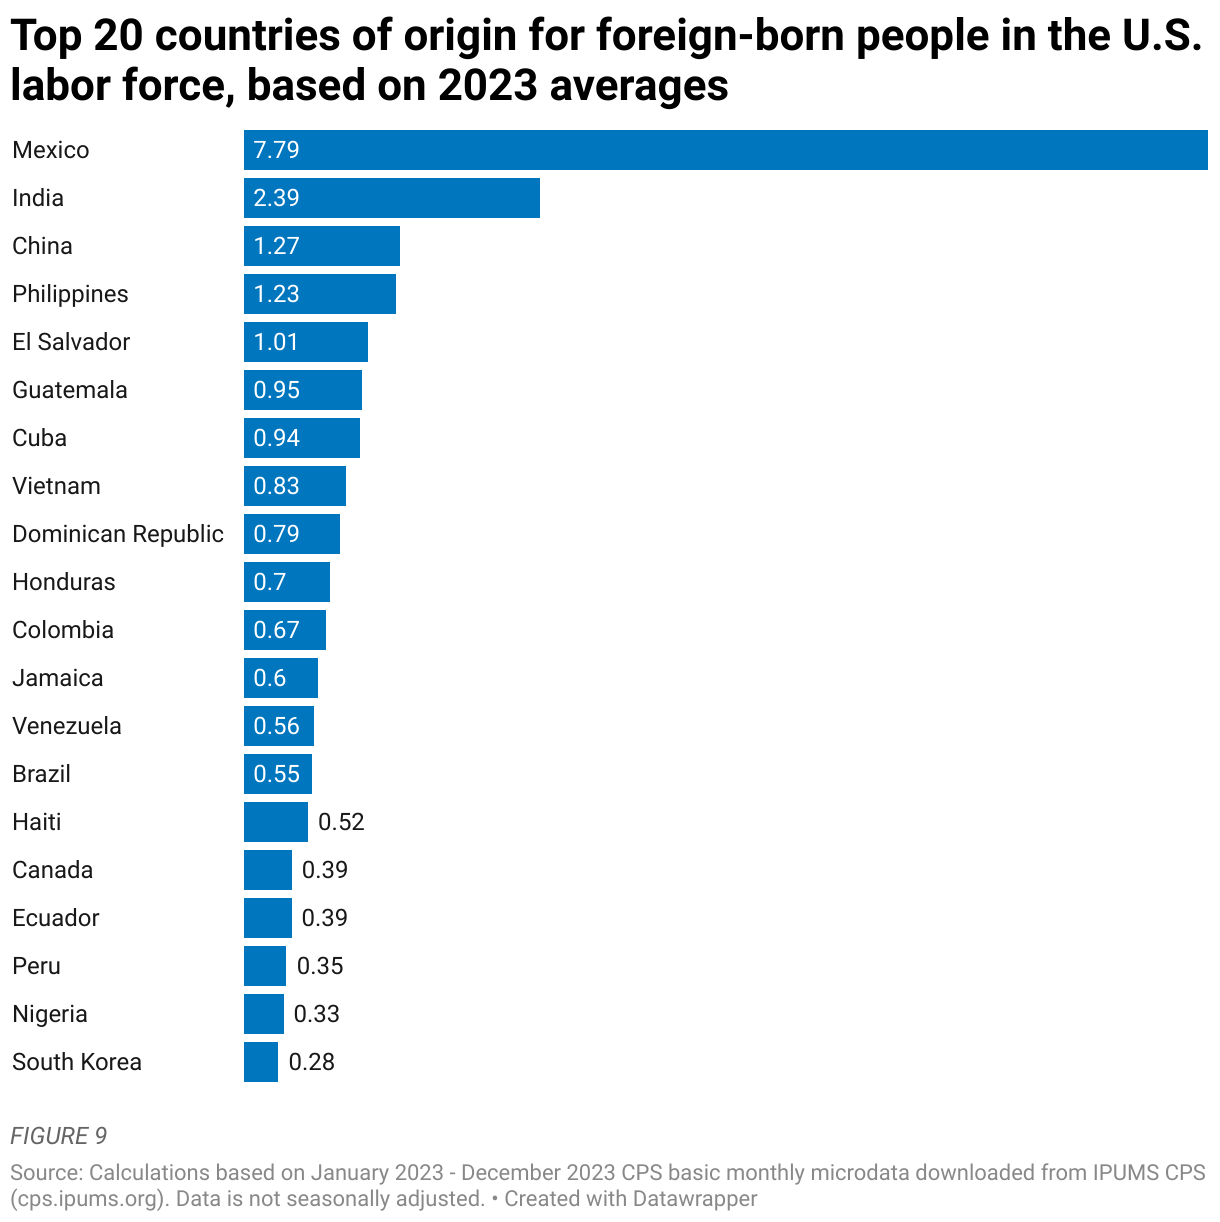
The U.S. is the most popular migrant destination in the world by a wide margin, and as such, it comes as no surprise that the foreign-born U.S. labor force includes people from essentially every country on Earth. However, a handful of countries of origin are especially common. Figure 9 shows the top 20 birth countries for members of the foreign-born U.S. labor force in 2023. In this year, the average size of the foreign-born labor force was slightly less than 31.1 million, and about one-quarter of this population (approximately 7.8 million) came from Mexico. India, China, the Philippines, and El Salvador round out the top five, and Latin American countries (as defined in Figure 10) account for 11 of the remaining 15 spots. In fact, in this list, the only origin countries not in Asia or Latin America are Nigeria and Canada.
Takeaways/Implications
7.8M
With an average of nearly 7.8 million people across the year, Mexico was the country of origin for about one-quarter of foreign-born U.S. labor force participants in 2023.
1M+
On average in 2023, 1 million or more labor force participants came from four additional countries: India, China, the Philippines, and El Salvador.
58%
On average in 2023, the top 10 migrant countries of origin accounted for nearly three-fifths (58%) of all foreign-born labor force participants, and the top 20 accounted for nearly 75%.
18
18 of the 20 countries listed in Figure 9 are in Latin America or Asia (the only exceptions are Canada and Nigeria).
KEY FINDING NO. 10
Most Recent Migrants in the Labor Force Come from Latin America or Asia
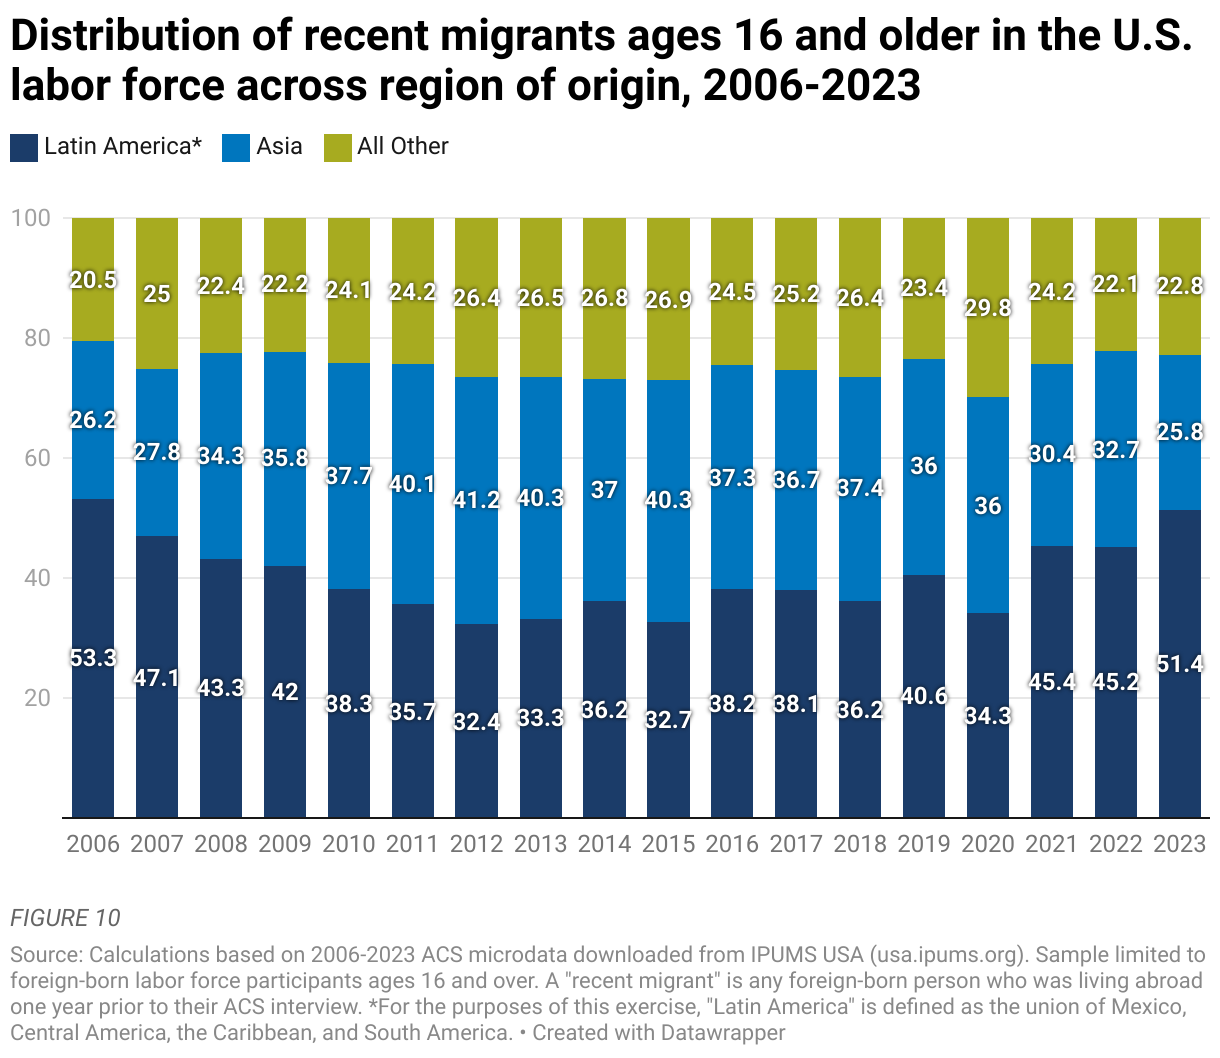
Figure 9 examined the origin countries of all foreign-born labor force participants, regardless of year of entry. If we restrict our attention to recent migrants ages 16 and over who are labor force participants (a group we will henceforth refer to as “recent migrants” for brevity), we find that Latin America and Asia account for the vast majority (roughly 70% to 80%) of inflows in any given year during 2006-2023. Figure 10 shows that people from Latin America represented an absolute majority of recent migrants in 2006; however, Asia’s importance grew in the late 2000s, and for several years in the 2010s, a plurality of recent migrants came from this region. Even so, in the pandemic and post-pandemic era, Latin America has re-emerged as the most common region of origin, with 51.4% of recent migrants coming from there in 2023.
Although not shown in Figure 10, a closer look at flows from individual countries reveals that more recent inflows of migrants tend to be more dispersed across origin countries. For example, in 2006, over a third of recent migrants came from Mexico, and only four countries (Mexico, India, the Philippines, and China) accounted for just over half of all recent migrants. Flashing forward to 2023, Mexico still ranked first but only accounted for about 13.3% of recent migrants. Furthermore, the top four countries in this year (Mexico, India, Venezuela, and Brazil) only accounted for 30.9% of all recent immigration.
Takeaways/Implications
70%-80%
Recent migrants (2006–2023) come from Latin America or Asia.
51.4%
Recent migrants of labor force from Latin America in 2023.
KEY FINDING NO. 11
Foreign-born Members of the Labor Force Are More Likely to Have Low and High Levels of Educational Attainment
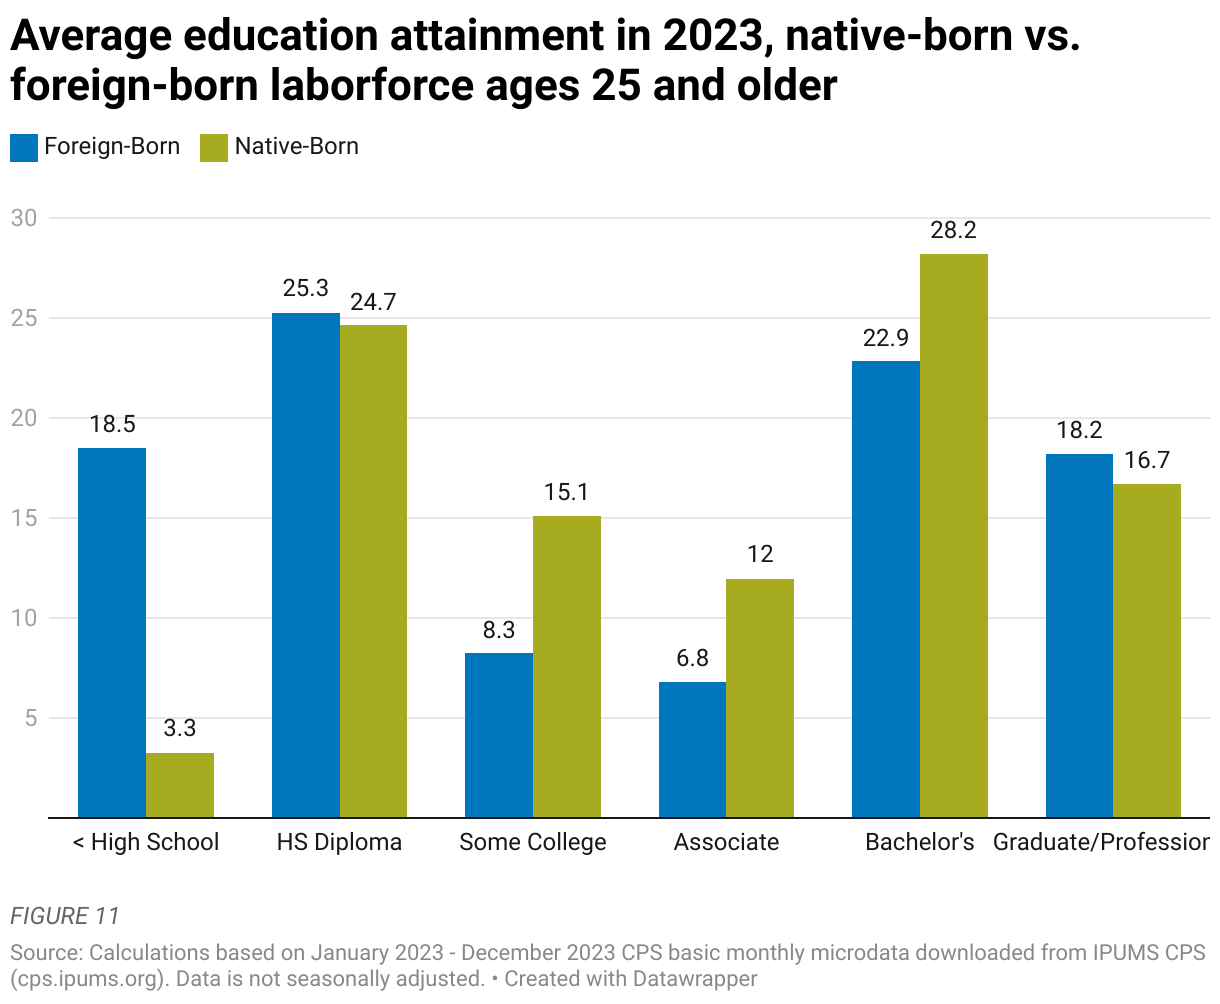
Foreign-born labor force participants differ from their native-born counterparts across a wide variety of demographic and socioeconomic dimensions. For example, we have already discussed the fact that foreign-born people are far more likely to be in their prime-working-age years. Another key difference relates to educational attainment among foreign-born and native-born labor force participants ages 25 and older, as shown in Figure 11. Perhaps the most notable difference between these two groups is that on average in 2023, the foreign-born labor force ages 25 and older was far more likely to have less than a high school education, and far less likely to have any level of undergraduate education, up to and including a bachelor’s degree. Having said that, the same foreign-born population was also notably more likely to have a graduate/professional degree. In other words, relative to their native-born counterparts, foreign-born labor force participants are more likely to lie at the extreme ends of the educational distribution.
Takeaways/Implications
18.5%
Foreign-born labor force participants with less than a high school education (2023).
15.1%
Foreign-born workers with graduate or professional degrees.
CONCLUSION
Foreign-born migrants have always represented a key part of America’s workforce, though the size and characteristics of this population have varied considerably over time. As of October 2024, there were nearly 50 million foreign-born people ages 16 and older living in the U.S., including 32.4 million labor force participants and 31.1 million people with a job. It is well known that certain states, industries, and occupational groups are particularly reliant on the labor supplied by foreign-born migrants; however, the more compelling finding in this brief may be the fact that there are very few parts of the U.S. workforce in which foreign-born people do not make substantial contributions. Given rapid aging in the domestic population and a persistent labor shortage that predates the pandemic, it seems likely that these contributions will only grow as U.S. employers cast an increasingly wide net to find the skilled workers they need to be competitive in the global economy.
Now Read "What To Do During an Immigration (ICE ) Workplace Visit"
It is critical for HR and management to have a structured response plan to ensure the company remains compliant while protecting its legal rights. This guide outlines key steps HR should take to handle an ICE visit efficiently, minimize disruption, and coordinate with legal counsel.