Overview
The Hiring Difficulty and Retention Difficulty Indexes, introduced in Q3 2024, measure retention and hiring difficulty based on HR executive responses to paired questions about the difficulty of hiring and retaining employees over the past 12 months and the next 12 months.
Each index can range in value from a maximum of 100 to a minimum of -100, with higher numbers indicating greater retention/hiring difficulty. A score near zero indicates that many respondents are selecting “average,” or that the shares of respondents selecting “high” and “low” are similar, or a combination of both.
Insights from the Hiring Difficulty Indexes
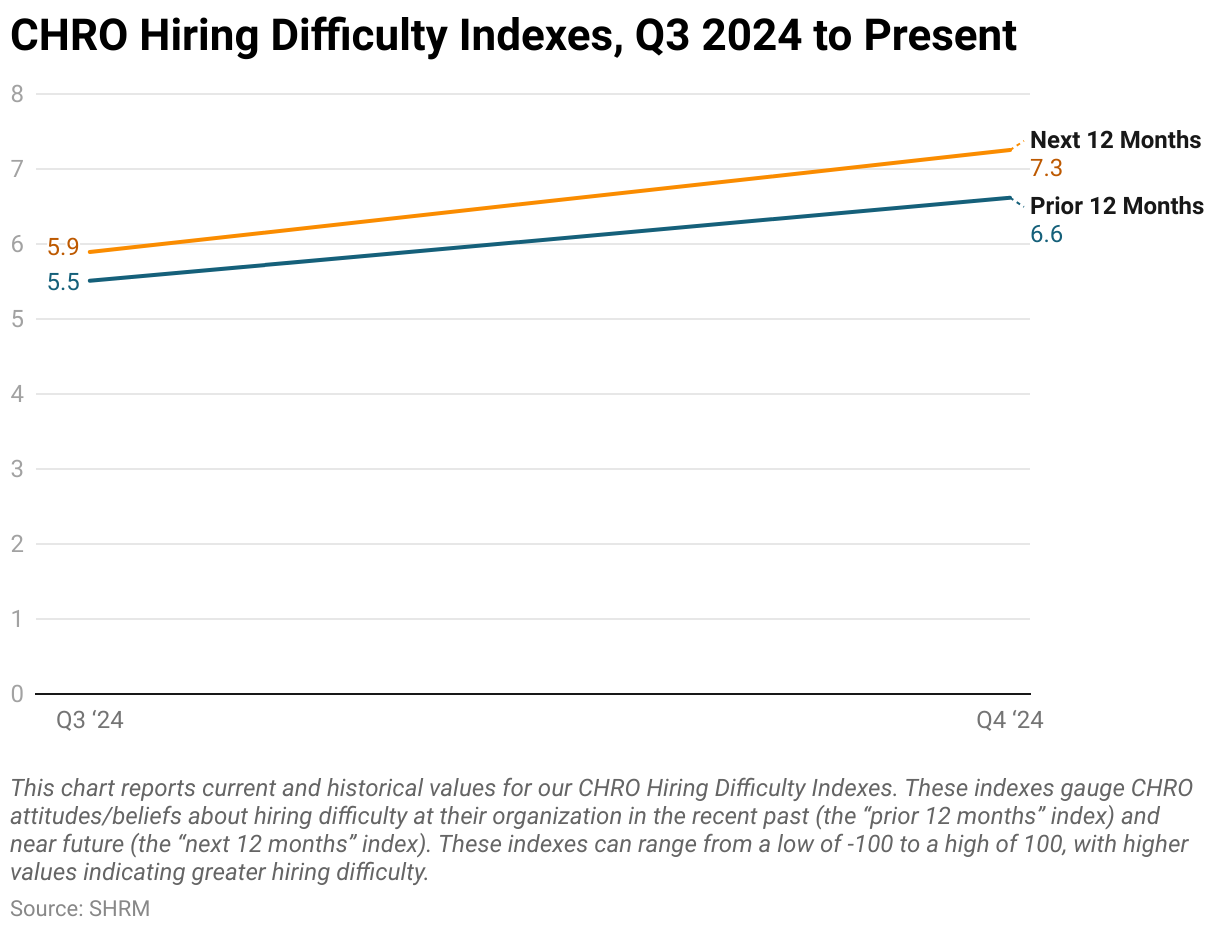
The chart reports index values for both of the hiring indexes. Respondents were asked, “In the last 12 months, has the difficulty level for hiring new employees been high, low, or average relative to what is typical for your organization?” and “In the next 12 months, do you expect the difficulty level for hiring new employees to be high, low, or average relative to what is typical for your organization?” Index values range from -100 to 100. Higher positive values indicate higher hiring difficulty, whereas increasingly negative values indicate lower difficulty. Values close to zero indicate that many respondents are selecting “average,” or that the shares of respondents selecting “high” and “low” are similar, or a combination of both.
Because these indexes are so new, we do not yet know what a “typical” month will look like, or how much variation we’ll see from month to month. Having said so, our two quarters of data to date suggest that a significant majority of respondents’ organizations experienced average hiring difficulty during the previous 12 months; similarly, most respondents expect their organization to face average hiring difficulty in the next 12 months. Furthermore, whether considering the prior 12-month period or future 12-month period, respondents who didn’t select the “average” option were substantially more likely to select “higher than average.”
The net result of these responses is that both hiring index values were small, positive numbers in Q3 and Q4 of 2024, with a slight indication that hiring difficulty rose between Q3 and Q4. These findings are consistent with traditional metrics, which suggest that that U.S labor market has cooled substantially from its pandemic-era peak but remains competitive by historical standards.

SHRM Talent Acquisition Specialty Credential
Help your leaders boost their skills and demonstrate their proficiency as strategic talent acquisition partners.
Insights from the Retention Difficulty Indexes
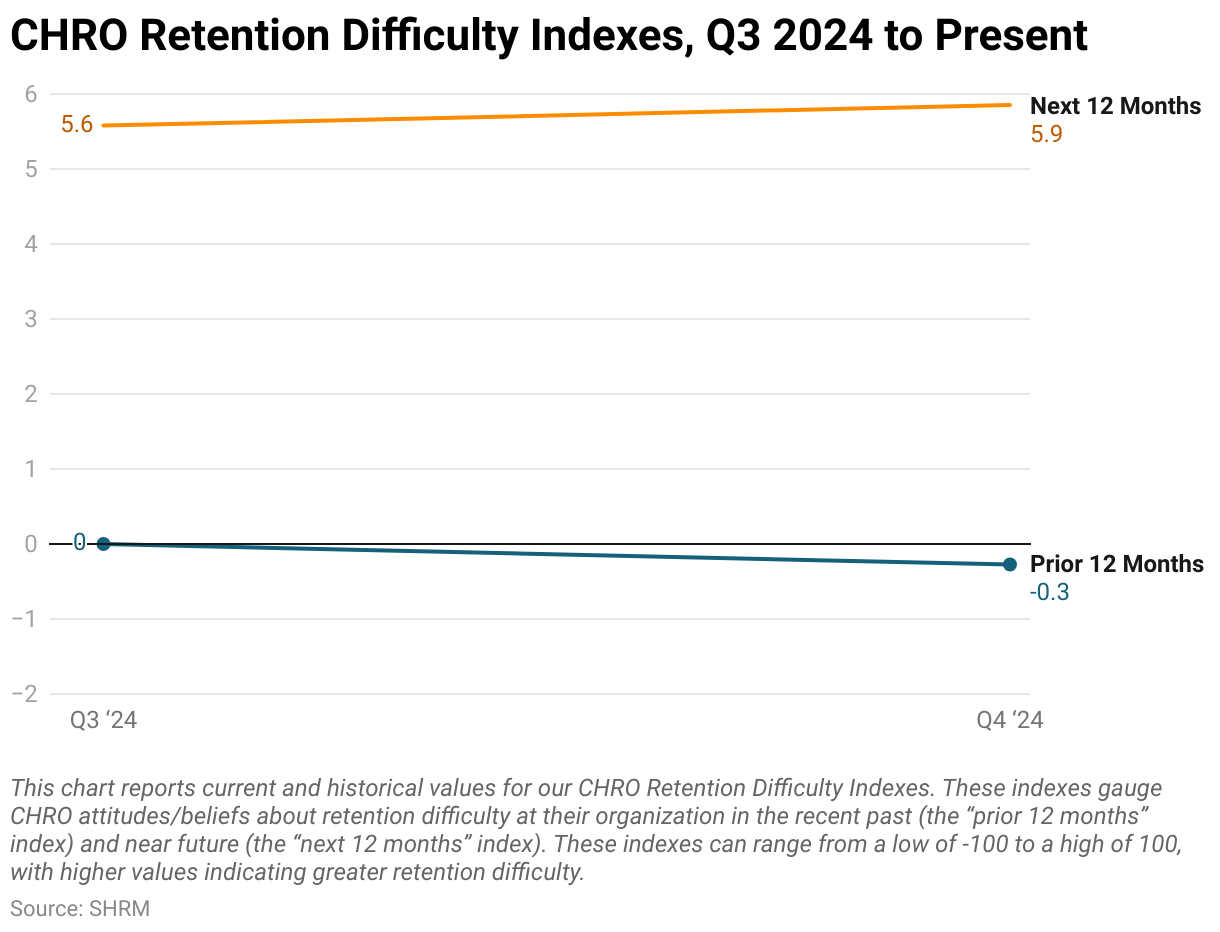
The chart reports index values for both of the retention indexes. Respondents were asked, “In the last 12 months, has the difficulty level for retaining existing employees been high, low, or average relative to what is typical for your organization?” and “In the next 12 months, do you expect the difficulty level for retaining existing employees to be high, low, or average relative to what is typical for your organization?” Index values range from -100 to 100. Higher positive values indicate higher retention difficulty, whereas increasingly negative values indicate lower difficulty. Values close to zero indicate that many respondents are selecting “average,” or that the shares of respondents selecting “high” and “low” are similar, or a combination of both.
As was the case with the Hiring Difficulty Indexes, the fact that we only have two quarters worth of data for both Retention Difficulty Indexes makes it difficult for us to assess how typical these values are. In both Q3 and Q4 2024, a significant majority of respondents reported that their organization had faced average retention difficulty during the previous 12-month period. The minority of respondents who did not fall into this category were nearly evenly split between the “higher than average” and “lower than average” options, resulting in an index value of exactly zero in Q3 2024 and nearly zero in Q4 2024.
A substantial majority of respondents also reported that they expected their organization to face average retention difficulty over the next 12-month period; however, the respondents who did not fall into this majority were significantly more likely to select the “higher than average” option. As a result, these initial findings suggest a slight apprehension among HR leaders regarding elevated retention difficulty heading into 2025.

SHRM Total Rewards Specialty Credential
Design competitive compensation and benefits programs that boost employee engagement with the SHRM Total Rewards Specialty Credential.
Methodology
The CHRO Business Outlook survey is a research study conducted quarterly. The survey was fielded electronically using the SHRM Voice of Work Research Panel to U.S.-based HR executives and senior HR executives (VP+). Respondents represented organizations of all sizes and across industries.
| Quarter, Year | Sample Size (n) | Fielding Dates |
|---|---|---|
| Q3 2024 | n = 339 | 07/17/24 – 07/25/24 |
| Q4 2024 | n = 320 | 10/16/24 – 10/25/24 |
Read the Q4 2024 series:
CHRO Employment Outlook | CHRO Economic Outlook | SHRM Hiring & Retention Difficulty Indexes