To stay competitive, companies need to keep a finger on the pulse of pay rates with access to current and accurate market data. By market-pricing the external value of individual jobs, companies can create competitive pay plans confidently and allocate compensation costs wisely.
Below are highlights from the 2011 Culpepper Compensation Market Pricing Practices Survey, covering sources of market data and practices used for compensation analysis among mostly North American companies. Among the key findings and trends:
• Compensation surveys with job-specific, employer-provided data are by far the most common source of compensation market data.
• Over 85 percent of companies that use compensation surveys use multiple surveys.
• Approximately one-third of companies use compensation consultants as a source of compensation market data.
• Three out of four companies use spreadsheets for analyzing and managing compensation data.
Sources of Compensation Market Data
For companies using market data to analyze compensation and set pay levels, the most common source is compensation surveys conducted by third parties. Nearly 90 percent of participants reported using compensation surveys with job-specific, employer-provided data as a source of market data for compensation analysis.
Compensation consultants are the leading non-survey source. It is worth noting that many compensation consultants rely on compensation surveys for market data. Thus, the percentage of companies using survey market data directly or indirectly for analyzing compensation actually is higher than reported below.
Other relatively common sources of compensation market data include government labor databases (for example, from the U.S. Bureau of Labor and Statistics and Statistics Canada), recruiters, job postings and proxy filings for executives and directors in public companies.
One out of six companies reported that they use pay data gathered in job interviews and new-hire employment verification as a source of compensation market data.
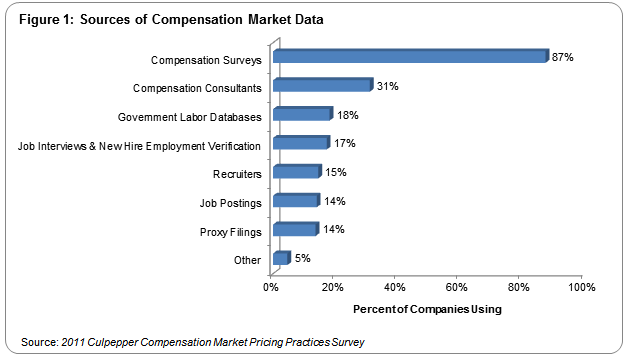
Participants reporting “other” indicated a variety of sources, including tax filings (such as IRS Form 990 for nonprofits) and filings by attorneys (such as H-1B visa).
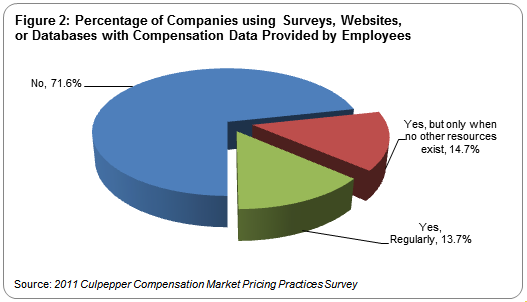
Employee-Provided Compensation Market Data
It is widely considered a best practice to use compensation surveys conducted by credible, third-party compensation firms that collect and verify data directly from executives or professionals within HR or the finance departments of participating organizations.
Most compensation professionals consider it a bad practice to use surveys and resources with compensation data self-reported from individual employees. The validity of employee-provided data is questionable because the job match (including leveling) and pay data has not been verified by the employer.
Over 70 percent of companies avoid using compensation surveys and resources with data collected from individual employees. Another 15 percent only use surveys with employee-provided data when no other resources exist.
Compensation Market Pricing Tools and Technology
Three out of four companies use spreadsheets such as Excel for analyzing and managing compensation survey data. Nearly one-third use compensation market pricing software or web-based tools from a third-party compensation firm or software vendors.
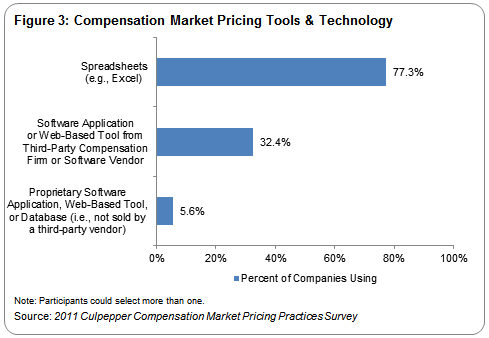
As companies increase in size, they are less likely to rely on spreadsheets and more likely to use software applications or web-based tools to analyze and manage compensation survey market data.
About the Survey
Data source:2011 Culpepper Compensation Market Pricing Practices Survey of 226 participating organizations.
Survey dates:June 22, 2011 through Sept. 23, 2011.
Participants by country:United States (89.6 percent); Canada (3.6 percent); other (6.8 percent).
Participants by sector:Technology (41.6 percent); life sciences (7.2 percent); health care (8.1 percent); manufacturing (12.7 percent); financial services/insurance (9 percent); business services (4.5 percent); other (16.9 percent).
Participants by number of employees: Up to 100 (10 percent); 101 to 500 (20.8 percent); 501 to 2,500 (28.5 percent); 2,501 to 10,000 (24 percent); over 10,000: (16.7 percent).
Participants by ownership/corporate status:Public (41.2 percent); private (41.2 percent); nonprofit (13.1 percent); other (4.5 percent).
Culpepper and Associates, Inc. conducts worldwide salary surveys and provides benchmark data for compensation and employee benefit programs. Reposted with permission. Source: Culpepper Compensation Market Pricing Practices Survey, October 2011,www.culpepper.com.
Was this resource helpful?
Validate your HR expertise
Earning your SHRM-CP credential makes you a recognized expert and leader in the HR field.
Related Content

Learn how Marsh McLennan successfully boosts staff well-being with digital tools, improving productivity and work satisfaction for more than 20,000 employees.

The proliferation of artificial intelligence in the workplace, and the ensuing expected increase in productivity and efficiency, could help usher in the four-day workweek, some experts predict.

As artificial intelligence technology continues to develop, the demand for workers with the ability to work alongside and manage AI systems will increase. This means that workers who are not able to adapt and learn these new skills will be left behind in the job market.